
Presenting LC/MS Results in a Publication
Liquid chromatography (LC) and mass spectroscopy (MS) can be combined to separate analytes within a sample. LC separates the sample based on its physicochemical properties, then, mass spectroscopy is used to separate analytes based on mass to charge ratio.
 SBshot87 | Shutterstock
How is LC-MS performed?
The sample first undergoes ionization before entering the mass spectrometer. Commonly used ionization methods are electrospray ionization and atmospheric pressure chemical ionization. Mass detection is carried out using triple quadrupole, ion trap, and quadrupole time of flight spectrometry.
LC-MS processing is a crucial step, and various software platforms are available for data processing and statistical analysis following initial data processing.
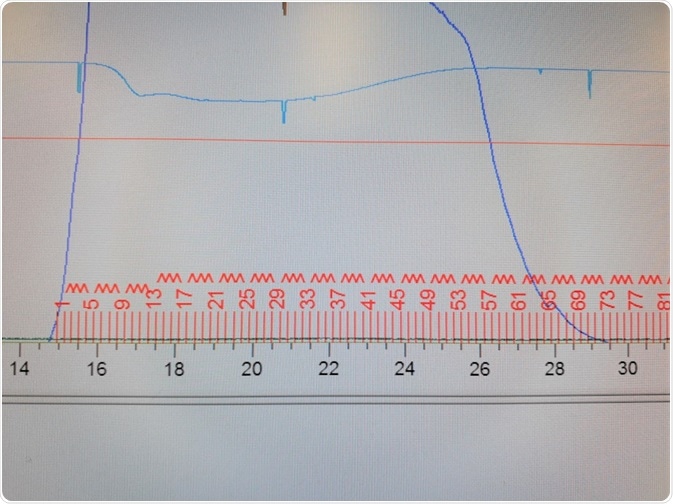
How are LC-MS data smoothed and peaks detected?
Software are currently available to help smooth data obtained from LC-MS. This smoothing helps to reduce or remove noise from data and aids in the detection and identification of peaks. In cases where the data are not noisy, or where the input data is available, this step is optional. To smooth data, a moving average filter is used, followed by a Savitzky-Golay filter.
The peaks are detected after smoothing of measurement data. There are two ways to detect peaks: a local maximum method and recursive threshold method. For each spectrum, all peaks are first detected. Next, peaks with lower intensity are filtered out and the new spectral peaks are connected with the previous case using a local maximum method in which every local intensity maximum along the spectra is treated as a peak.
In cases of a recursive threshold, user-defined peak widths are used. Two measures are calculated: peak height, calculated from the maximum intensity of all data points that form a peak, and peak area, the sum of intensities of all data points.
Alignment methods used in LC-MS
Alignment methods help in searching and reporting peaks from across different LC-MS runs. Although peaks that originate from the same compound match with respect to m/z values, variations may arise in retention times between runs.
The software used for this purpose uses a simple alignment method, in which one peak from the peak list is aligned to a row of master peaks that are best matched to it. In some cases, empty gaps may be present, as not every peak is detected and aligned.
How are normalization methods used with LC-MS?
Normalization methods are employed to reduce errors in data. Two methods exist: linear normalization and a new method that uses multiple internal standard compounds that are injected into samples. For linear normalization, all peak heights lying within a single peak are divided by the same number.
Normalization factors are then calculated in one of four ways: average peak height, average squared peak height, total raw signal, and maximum peak height.
How are visualization methods used with LC-MS?
After data processing, results are exported in the form of peak height and area matrix. This matrix is further processed using Matlab or R Statistical language. Different visualization methods are now available. These methods plot the peak in a two-dimensional graph, where retention time is plotted on the x-axis and m/z ratio is plotted on the y-axis.
The differences in peak heights are shown using differences in log ratios. Co-efficients of variation are also used to visualize and report the data where the variations in the peak heights within a sample are plotted.
Sources
- www.ncbi.nlm.nih.gov/pmc/articles/PMC1187873/pdf/1471-2105-6-179.pdf
- http://www.rsc.org/images/AMC%20LCMS%20Guide_tcm18-240030.pdf
- www.ecs.umass.edu/…/Chromacademy%20LCMS%20Intro.pdf
Further Reading
- All Liquid Chromatography Content
- Optimizing Protein Purification with FPLC
- Allergen Detection Using LC-MS
- LC-MS for Biomarker Discovery
Last Updated: Jan 28, 2019
Written by
Dr. Surat P
Dr. Surat graduated with a Ph.D. in Cell Biology and Mechanobiology from the Tata Institute of Fundamental Research (Mumbai, India) in 2016. Prior to her Ph.D., Surat studied for a Bachelor of Science (B.Sc.) degree in Zoology, during which she was the recipient of anIndian Academy of SciencesSummer Fellowship to study the proteins involved in AIDs. She produces feature articles on a wide range of topics, such as medical ethics, data manipulation, pseudoscience and superstition, education, and human evolution. She is passionate about science communication and writes articles covering all areas of the life sciences.
Source: Read Full Article